
Analytics & Buyer Intelligence // The Property and Flexible-Space Sales Operating System
When buyers show you what matters, your next conversation should reflect it.
SiteSee connects experience views, space-level attention, content use, guided pathways and next-step actions to the property experience. You can see what earned attention, compare how the experience was distributed and begin follow-up with evidence instead of rebuilding the complete presentation.
ReachAttentionContentPathwayAction
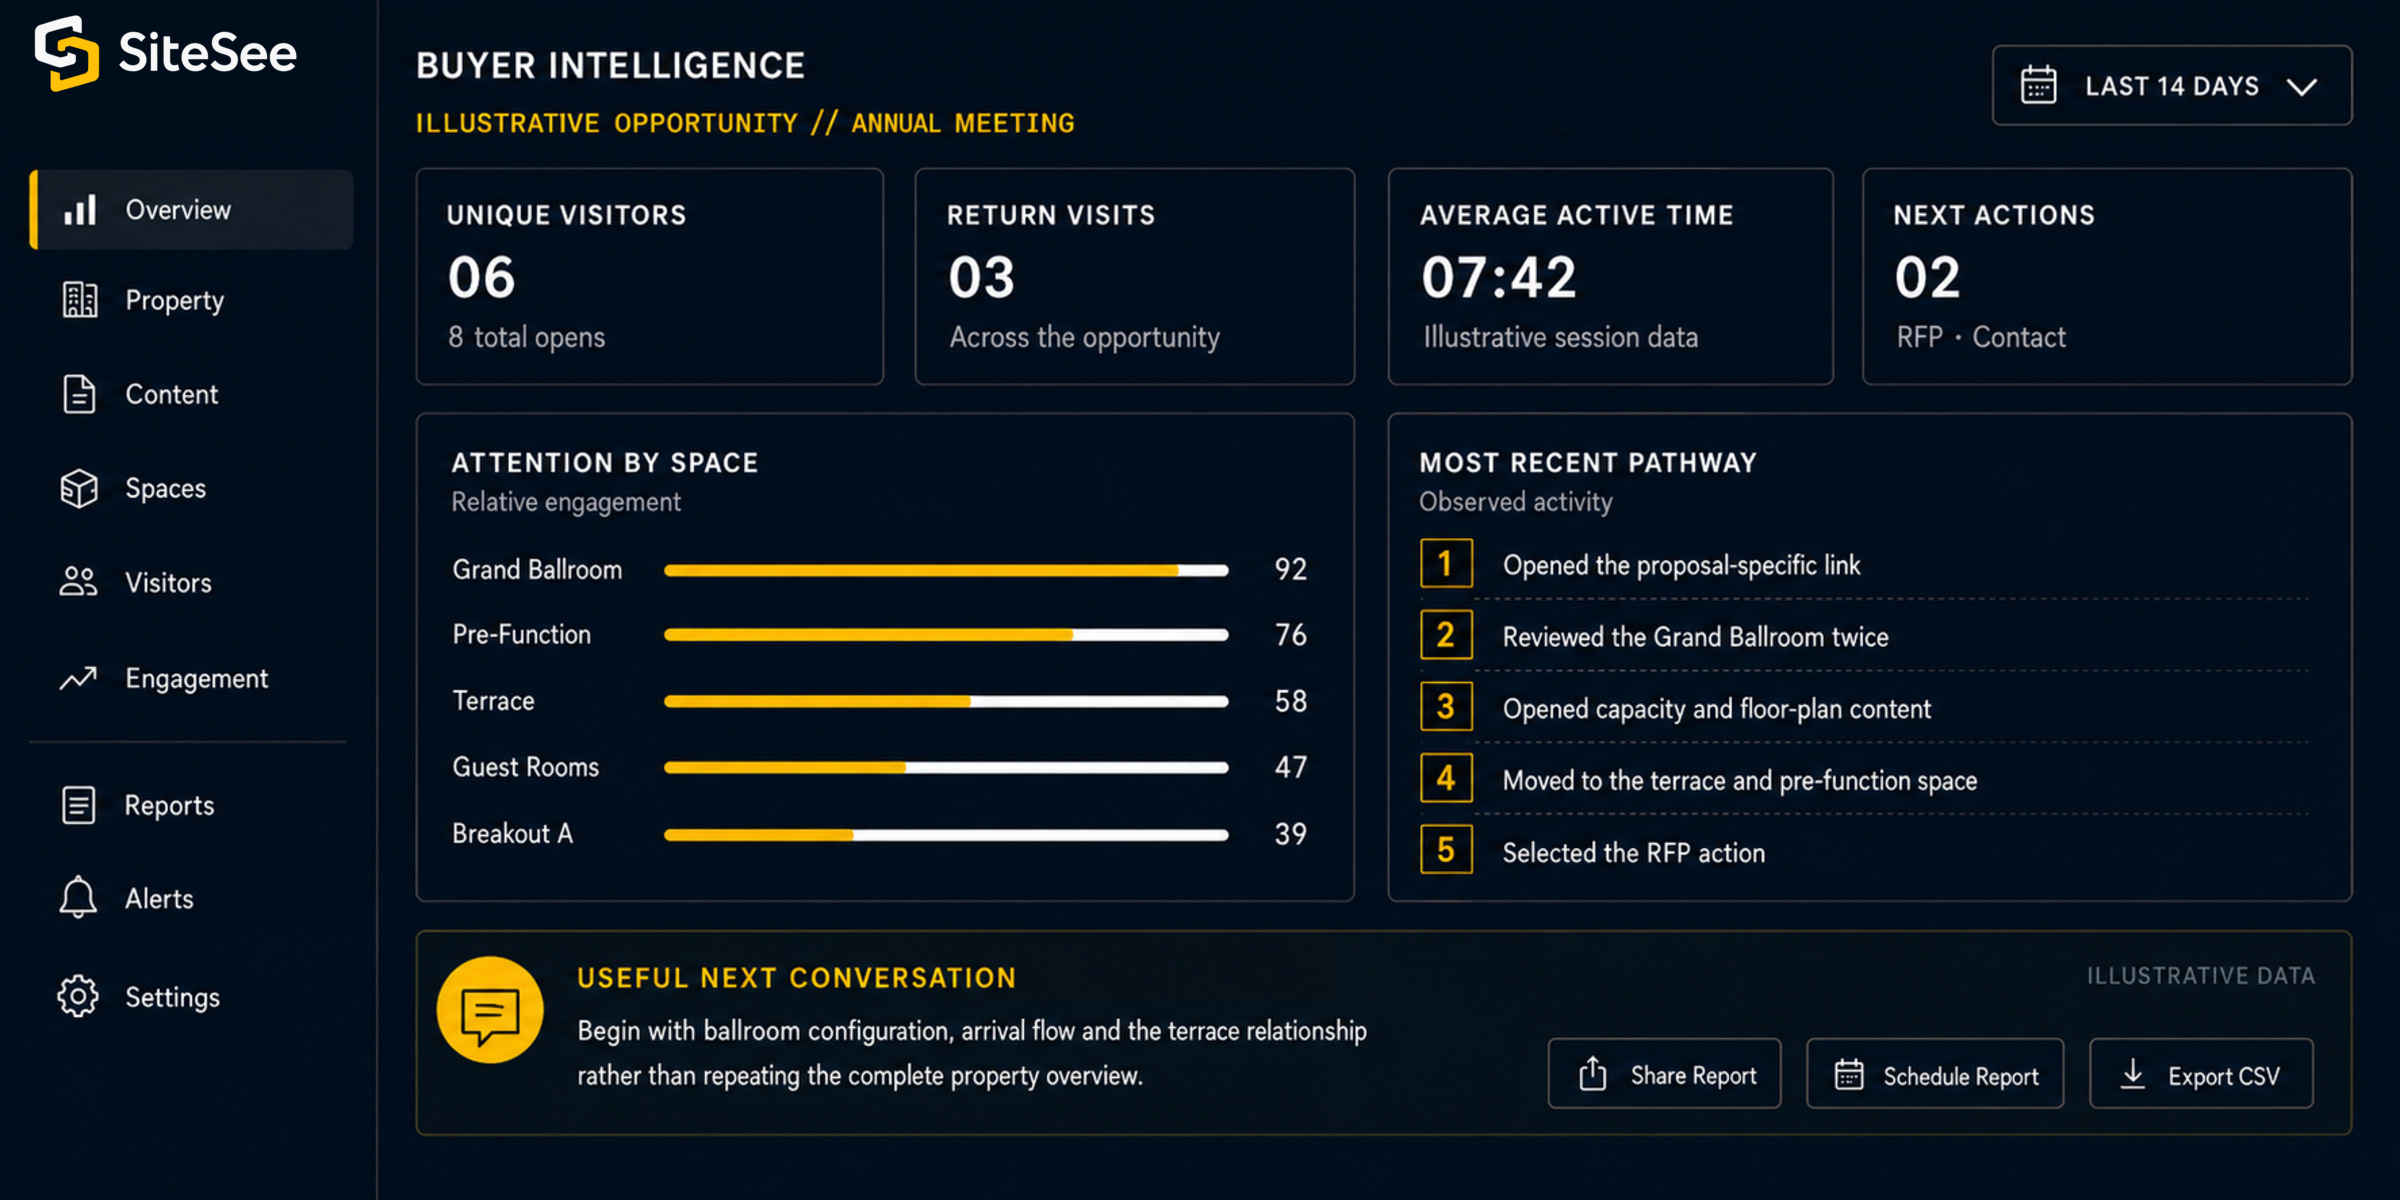
Buyer IntelligenceIllustrative Opportunity // Annual MeetingLast 14 days
Attention by spaceRelative engagement
Most recent pathwayObserved activity
- 1Opened the proposal-specific link.
- 2Reviewed the Grand Ballroom twice.
- 3Opened the capacity and floor-plan content.
- 4Moved to the terrace and pre-function space.
- 5Selected the RFP action.
Useful next conversationBegin with ballroom configuration, arrival flow and the terrace relationship rather than repeating the complete property overview.
Illustrative interface and sample data
From Distribution to Evidence
Once the link is sent, your team should not have to guess what happened next.
Static collateral may tell you that a file was sent or an email was opened. It rarely explains what the buyer did with the property information after arrival. SiteSee keeps the experience, the spaces, the content and the approved next actions connected, creating a more useful evidence trail for sales, marketing and leadership.
Practical resultYour next conversation can begin with demonstrated areas of interest instead of beginning again with basic orientation.
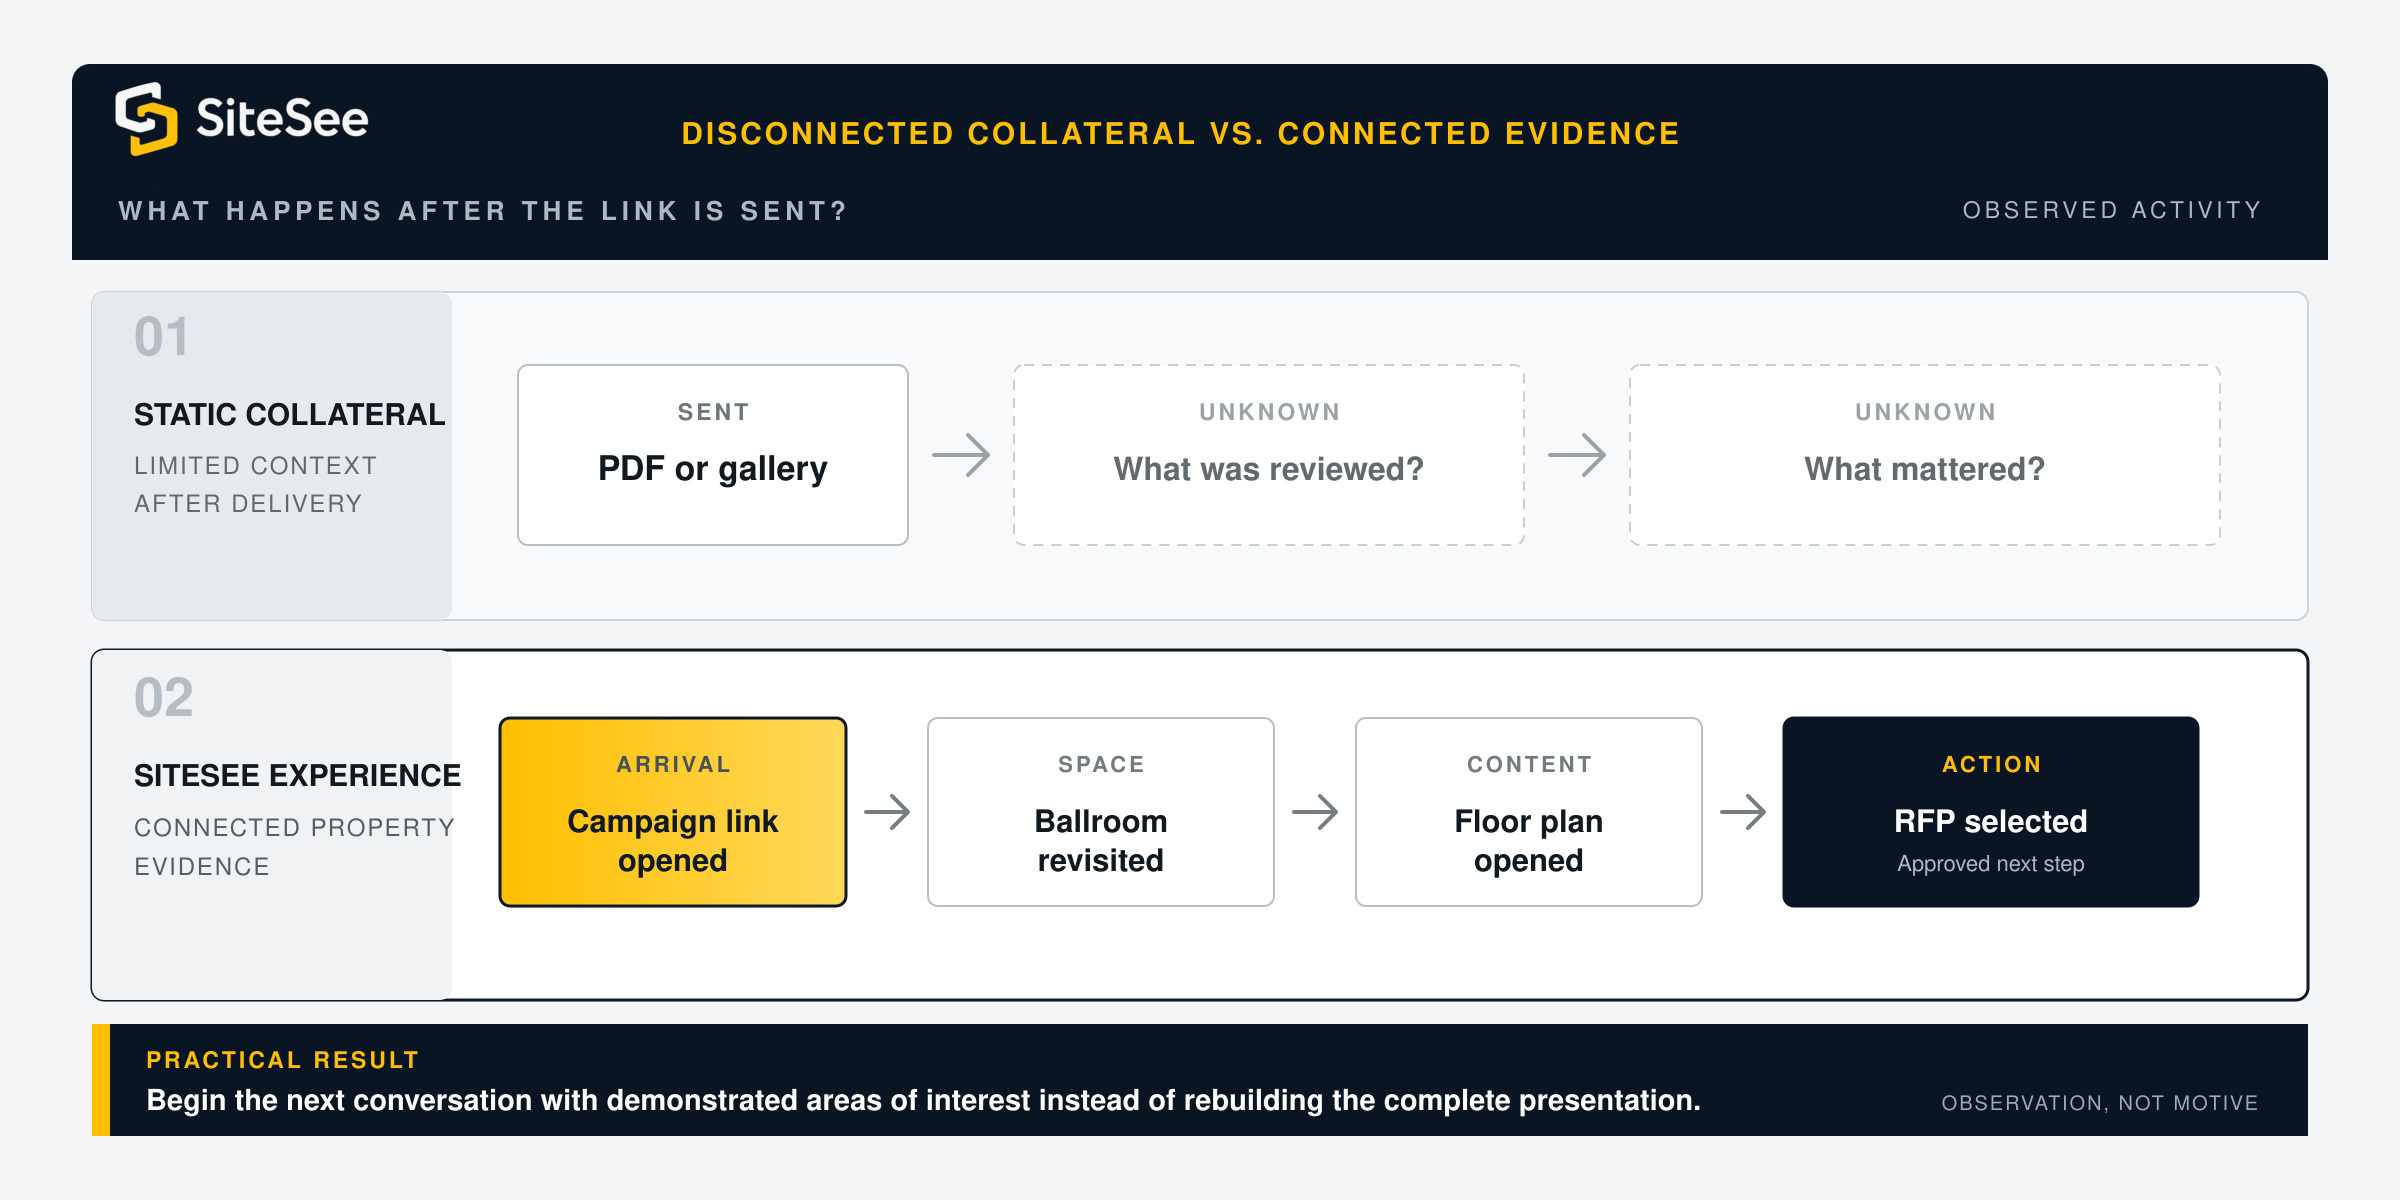
What happens after the link is sent?Disconnected collateral vs. connected evidence
01Static collateralLimited context after delivery
SentPDF or gallery
→UnknownWhat was reviewed?
→UnknownWhat mattered?
02SiteSee experienceConnected property evidence
ArrivalCampaign link
→SpaceBallroom revisited
→ContentFloor plan opened
→ActionRFP selected
Five Connected Evidence Layers
See how attention develops from first arrival to the next action.
Each layer answers a different customer question. Together they create a more complete picture of how the property experience was used without pretending that behavior reveals every motive behind it.
01
Reach
Understand arrival.
Your questionHow did buyers reach the experience and what viewing environment did they use?
Connected SiteSee evidenceViews, unique visitors, traffic source, channel, browser, device and geographic reporting where configured.
02
Attention
See where review concentrated.
Your questionWhich spaces held attention, received return visits or were inspected most closely?
Connected SiteSee evidenceActive time, space-level engagement, room rankings and spatial heat mapping where available.
03
Content
Know what evidence was used.
Your questionDid buyers open the floor plan, capacity information, video, specification or supporting document?
Connected SiteSee evidenceTag, media, menu, highlight, polygon, link and other approved content-interaction reporting.
04
Pathway
Understand progression.
Your questionHow far did the buyer move through the intended experience and where did the review change direction?
Connected SiteSee evidenceCampaign-specific Smart Links, guided-flow progression, completion, drop-off and shared-experience activity where deployed.
05
Action
Connect interest to the next step.
Your questionWhich contact, inquiry, RFP, lead form, share or other approved action followed the review?
Connected SiteSee evidenceCall-to-action, lead-form and contextual conversion tracking, subject to the approved implementation and privacy settings.
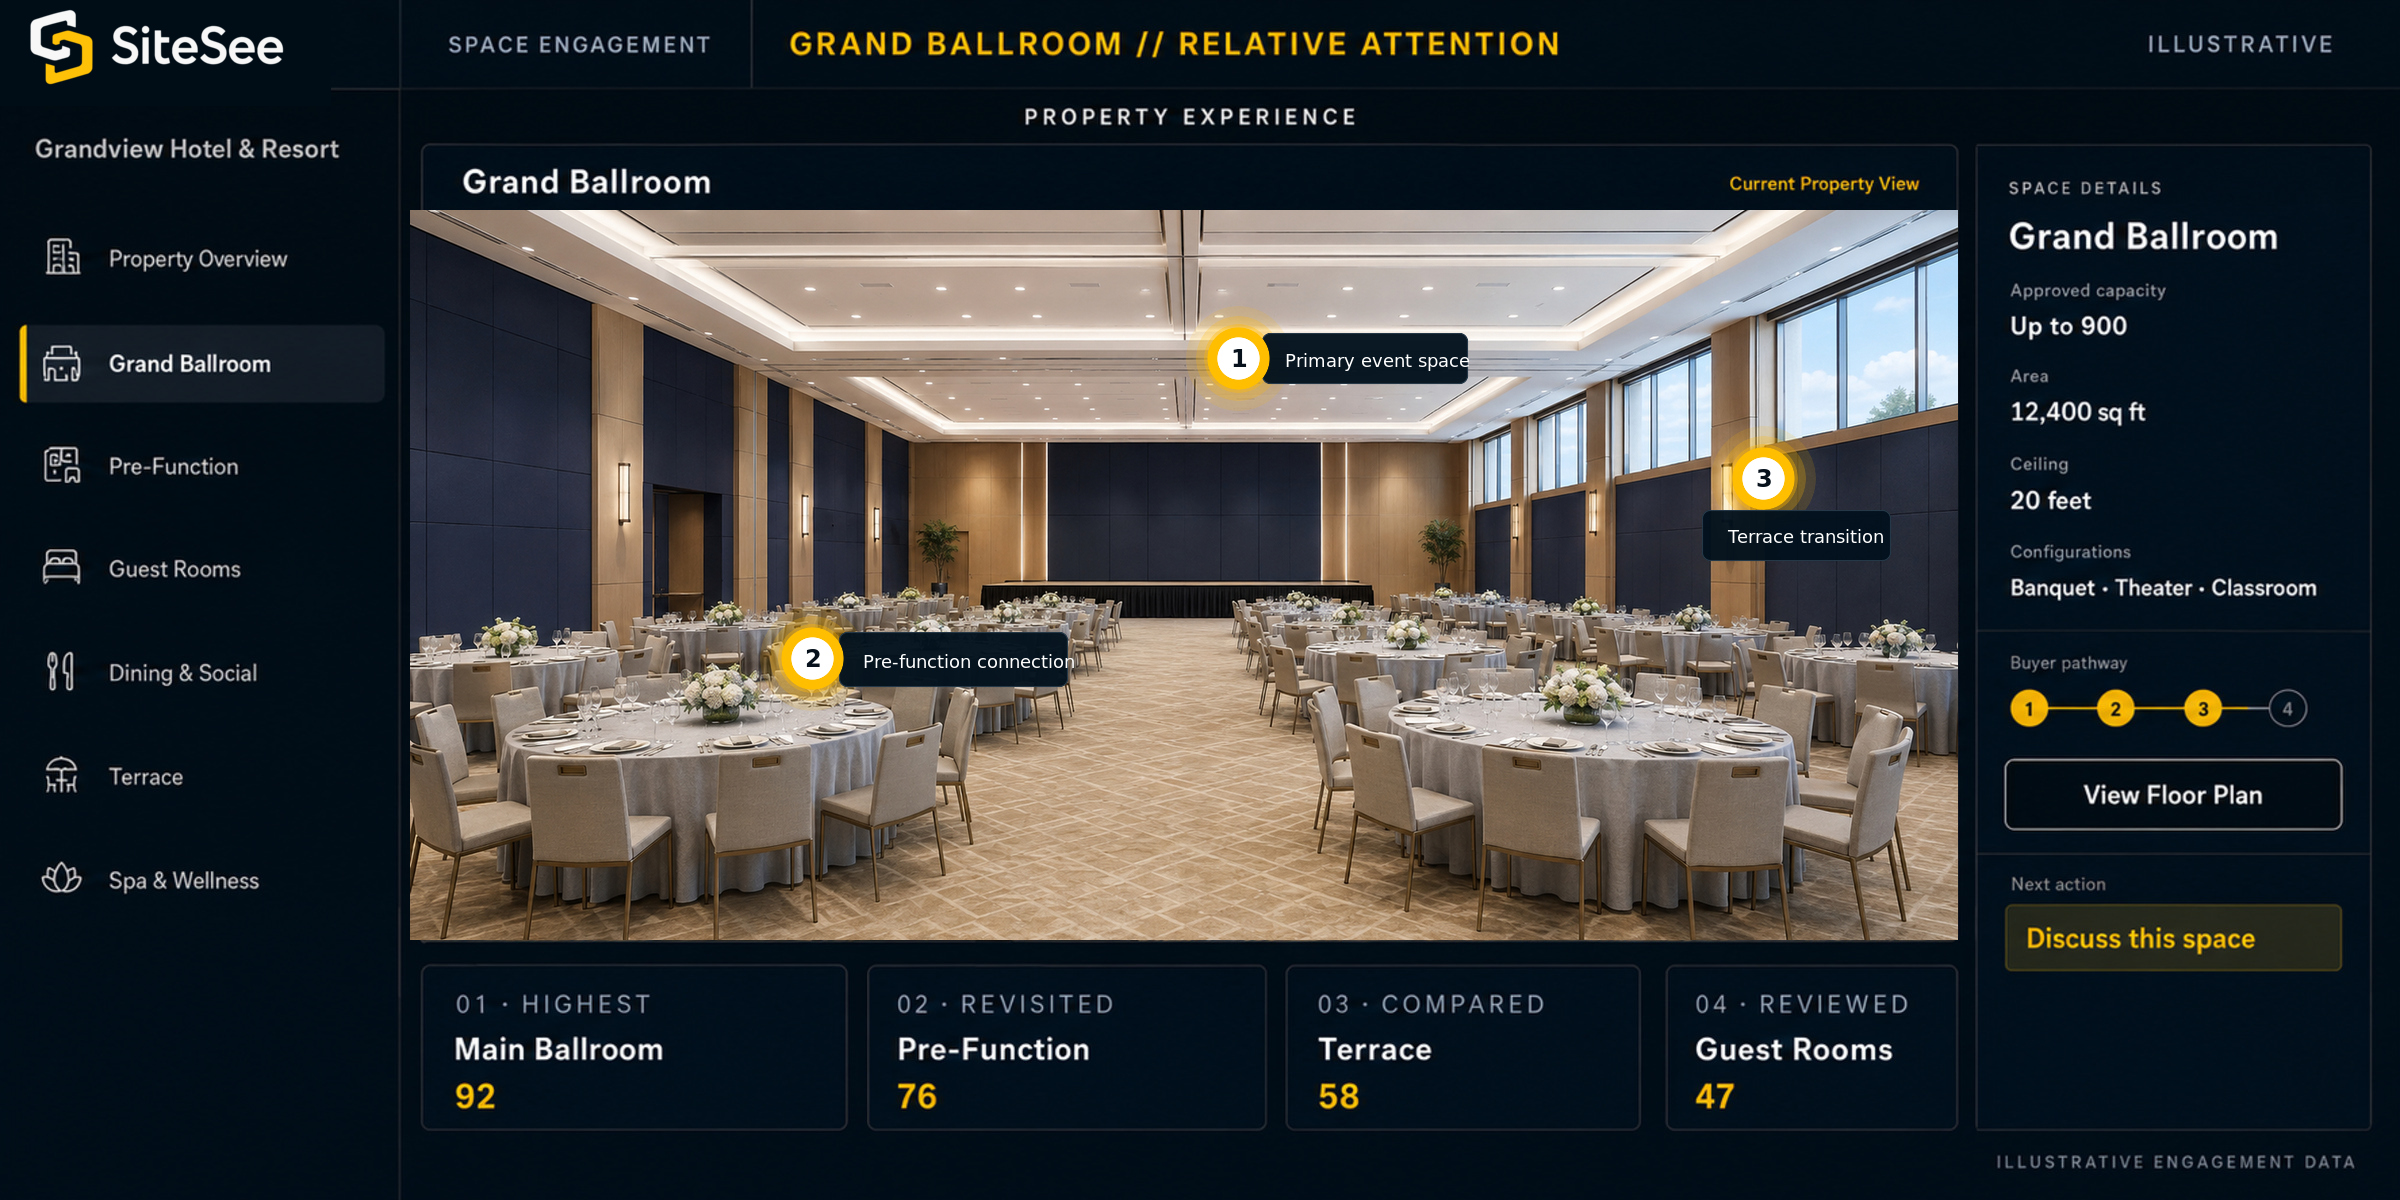
Space EngagementGrand Ballroom // Relative Attention
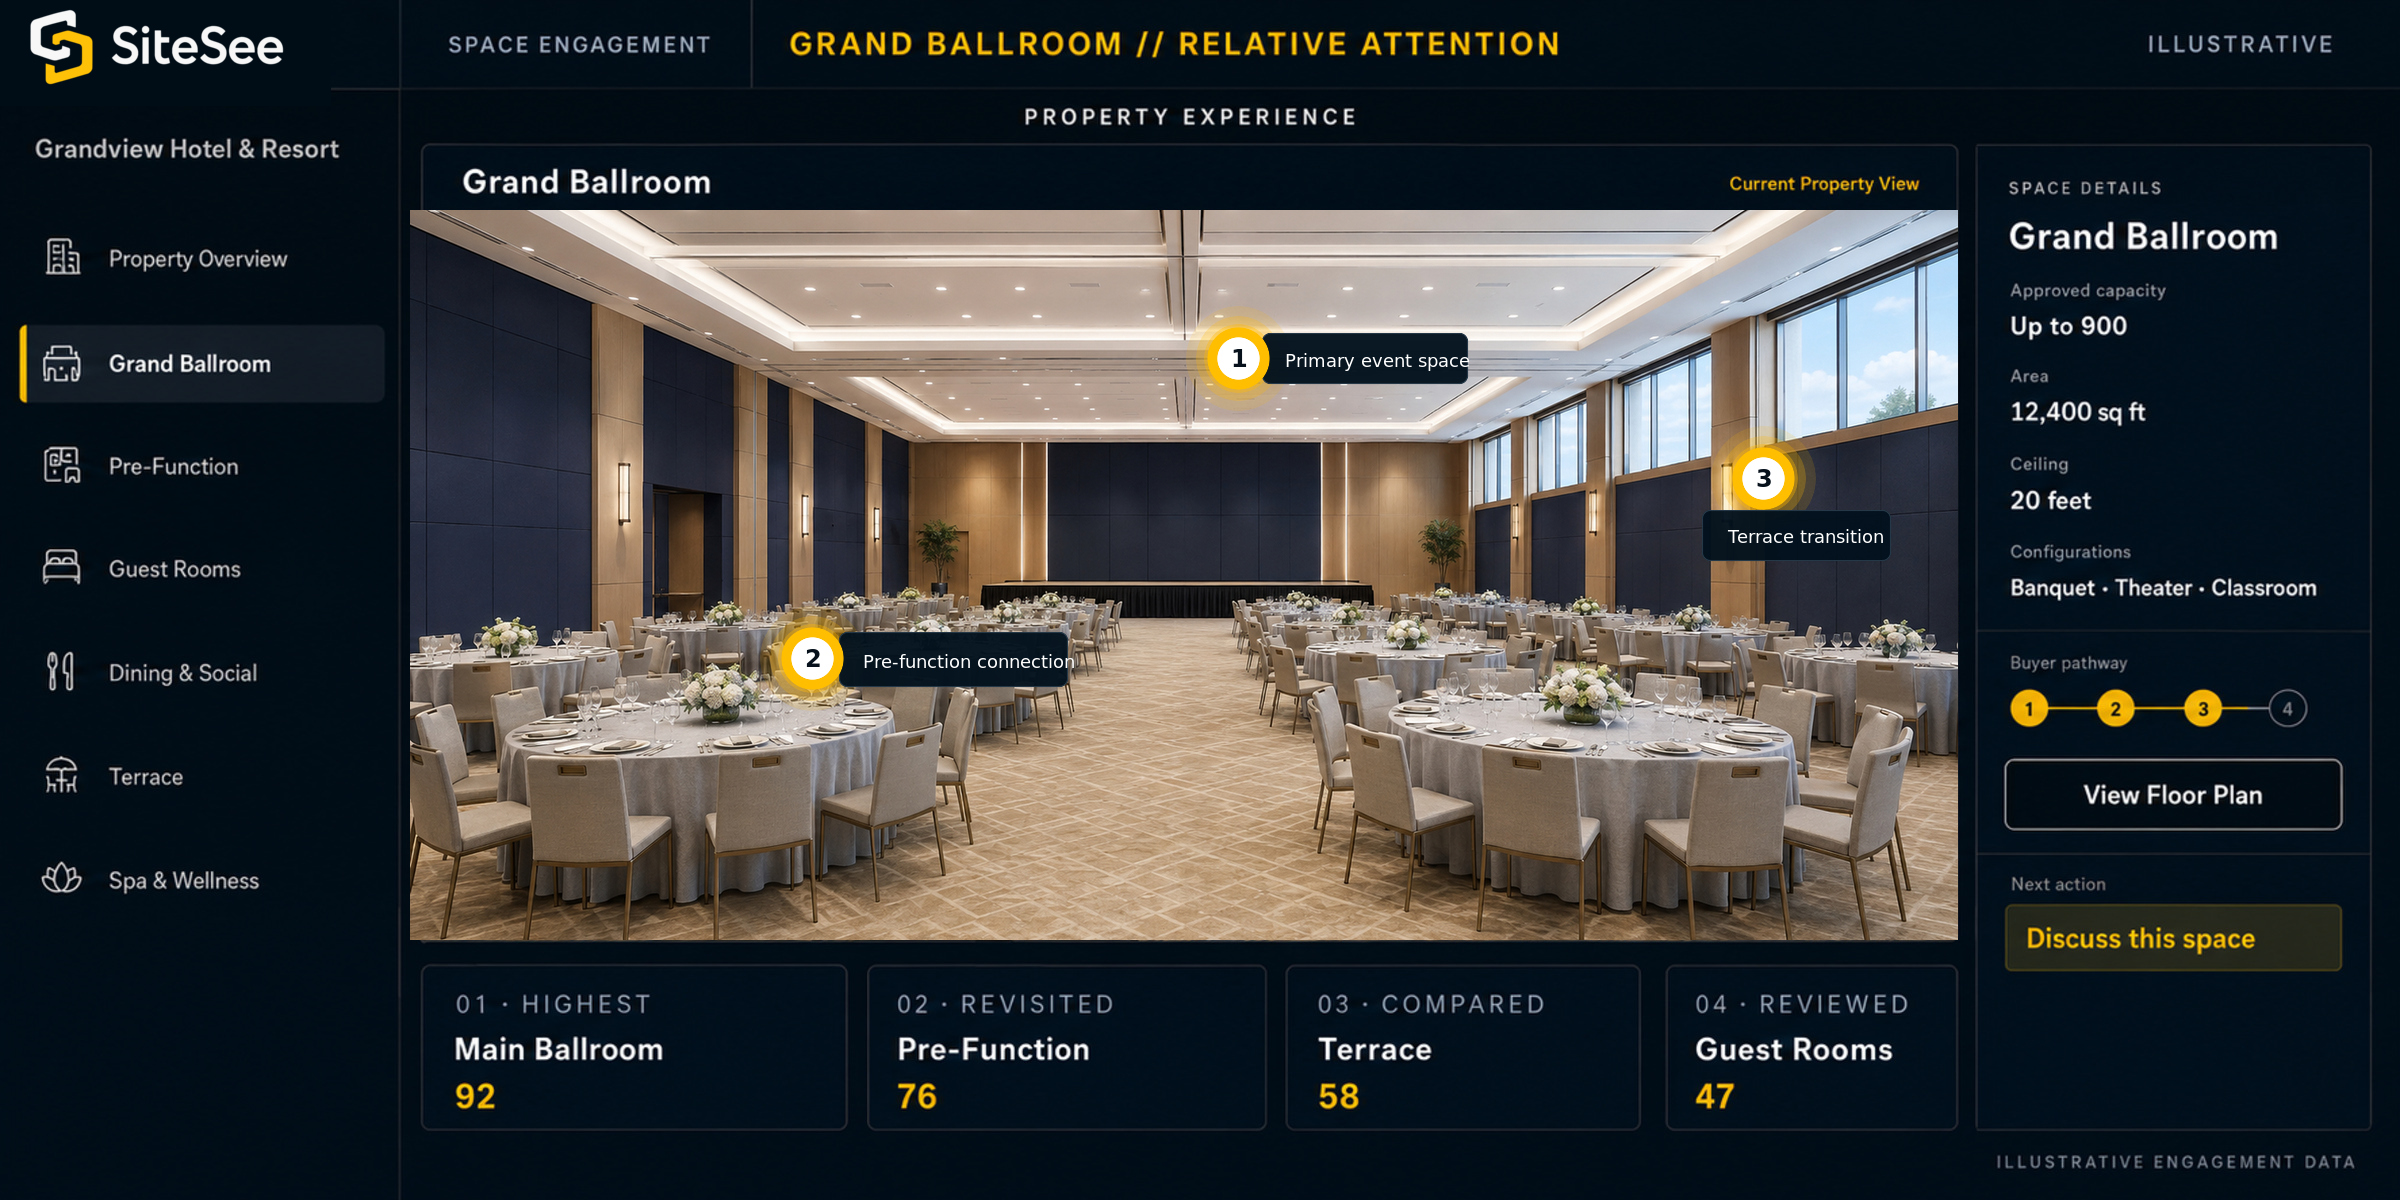 123
123Spatial Attention
Know which spaces earned attention and which questions deserve follow-up.
A property decision is spatial. Room-level engagement and heat mapping can show where review concentrated, which locations were revisited and how attention moved across the property. That evidence makes it easier to focus the next conversation on fit, flow, configuration, atmosphere or access.
Important boundaryAttention is observable behavior. It is not proof of motive, preference or purchase intent. The evidence should improve the next question, not replace the conversation.
From Signal to Conversation
Use engagement to ask a better next question—not to assume intent.
Buyer intelligence is most useful when it changes what your team does next. A viewing path can help sales begin with the spaces and evidence already under consideration instead of repeating everything the buyer has already seen.
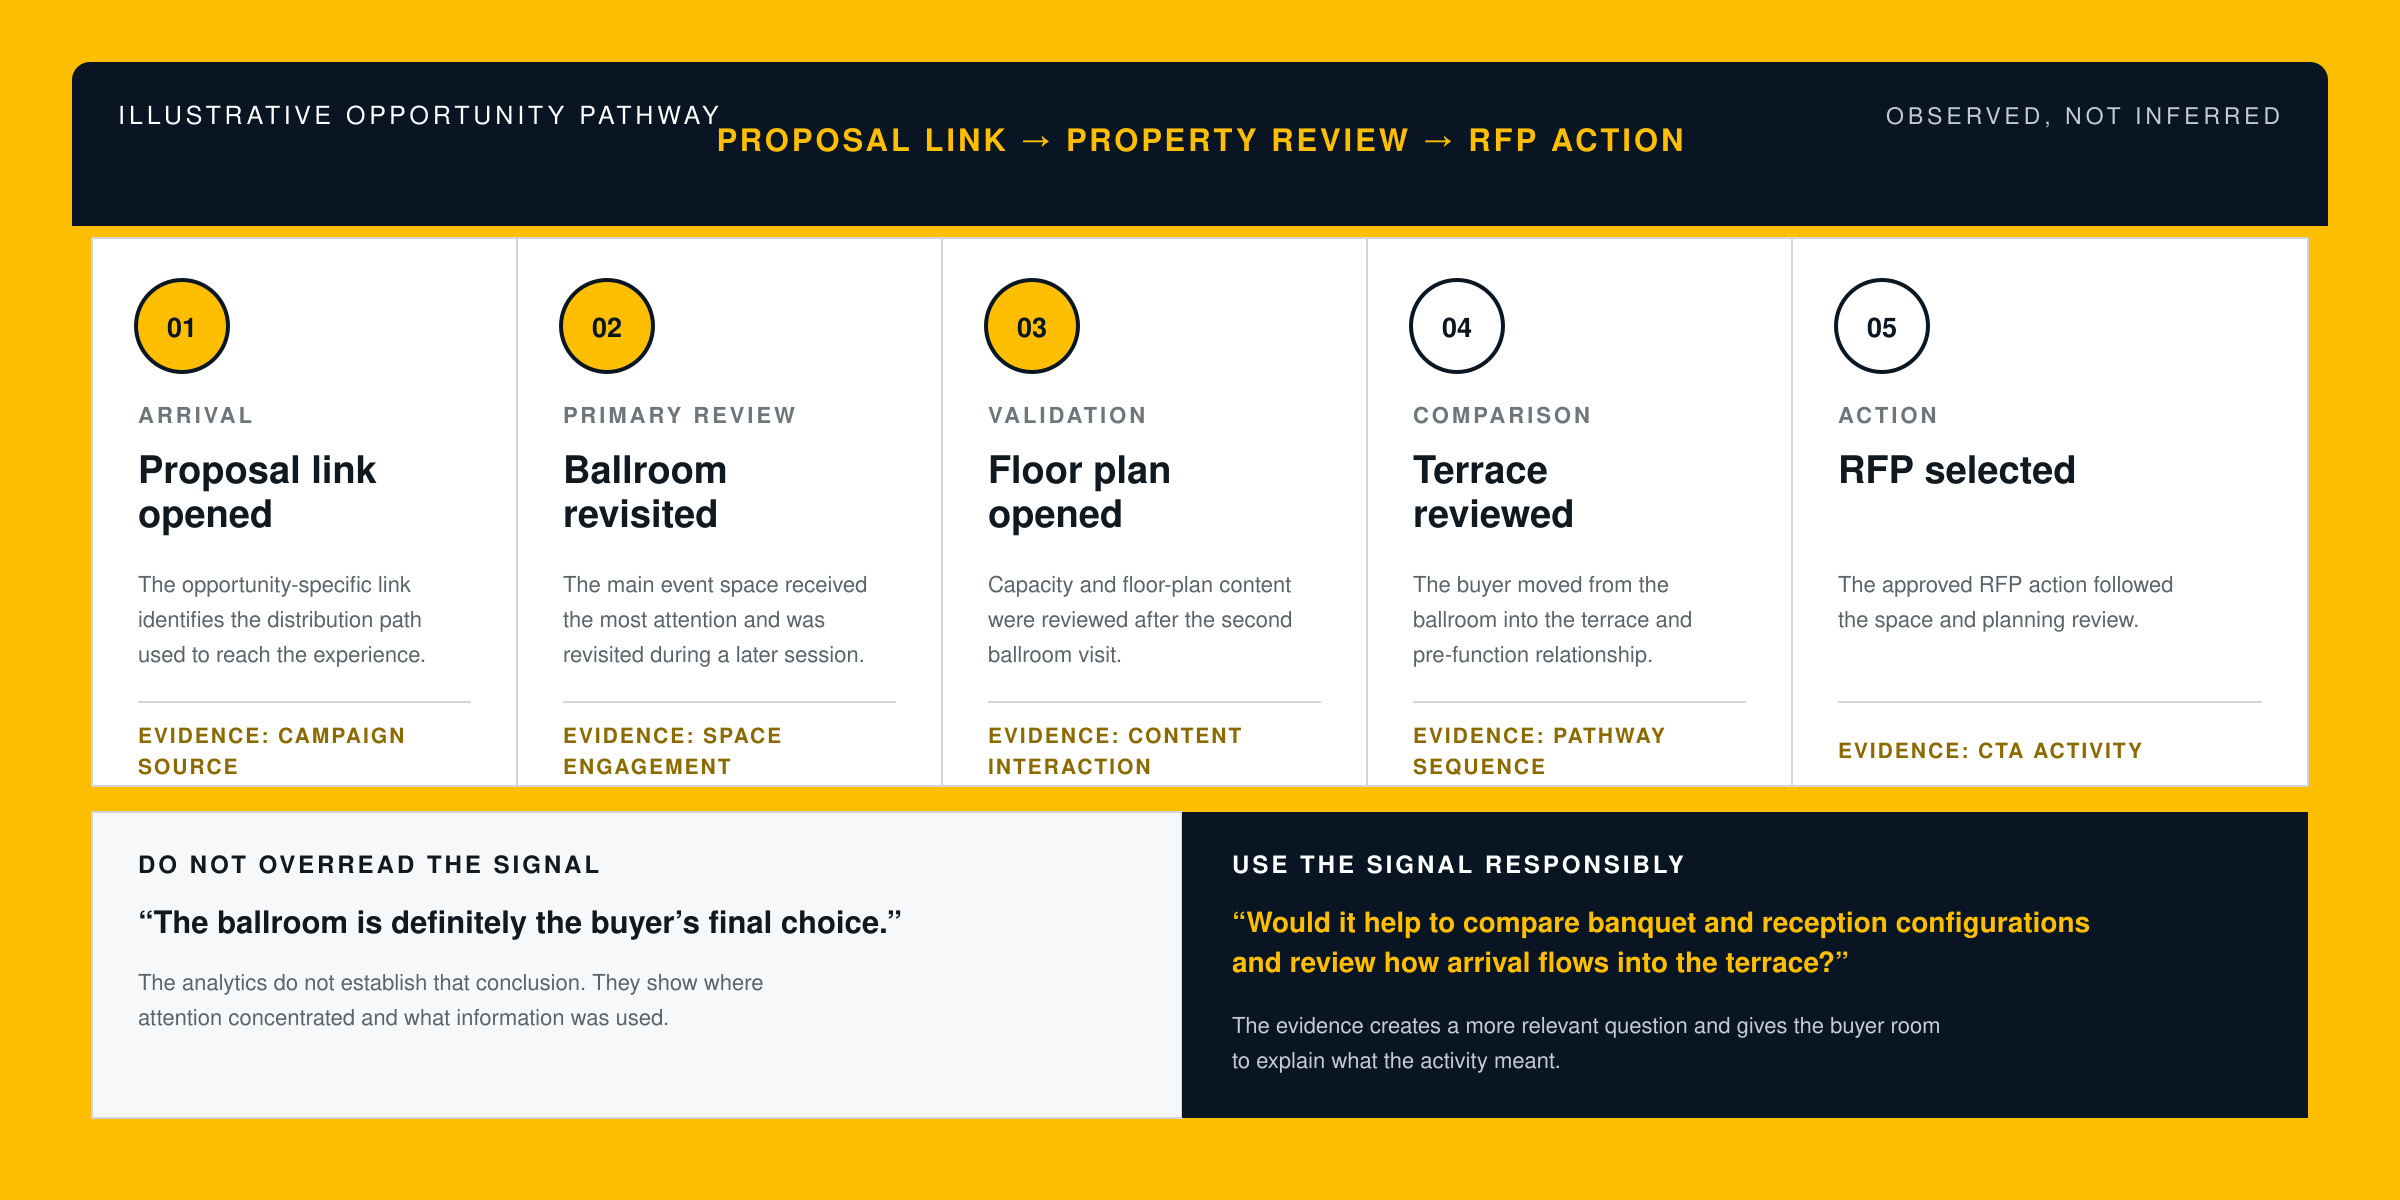
Proposal link opened
The opportunity-specific link identifies the distribution path used to reach the experience.
Evidence: campaign sourceBallroom revisited
The main event space received the most attention and was revisited during a later session.
Evidence: space engagementFloor plan opened
Capacity and floor-plan content were reviewed after the second ballroom visit.
Evidence: content interactionTerrace reviewed
The buyer moved from the ballroom into the terrace and pre-function relationship.
Evidence: pathway sequenceRFP selected
The approved RFP action followed the space and planning review.
Evidence: CTA activityDo not overread the signal“The ballroom is definitely the buyer’s final choice.”
The analytics do not establish that conclusion. They show where attention concentrated and what information was used.
Use the signal responsibly“Would it help to compare banquet and reception configurations and review how arrival flows into the terrace?”
The evidence creates a more relevant question and gives the buyer room to explain what the activity meant.
Campaign & Distribution Intelligence
See which channels bring buyers into meaningful property review.
Website traffic, proposal links, direct follow-up, partner referrals and sales campaigns may all produce different patterns of engagement. Campaign-specific links and source reporting help you compare how each path performs inside the property experience rather than counting delivery alone.
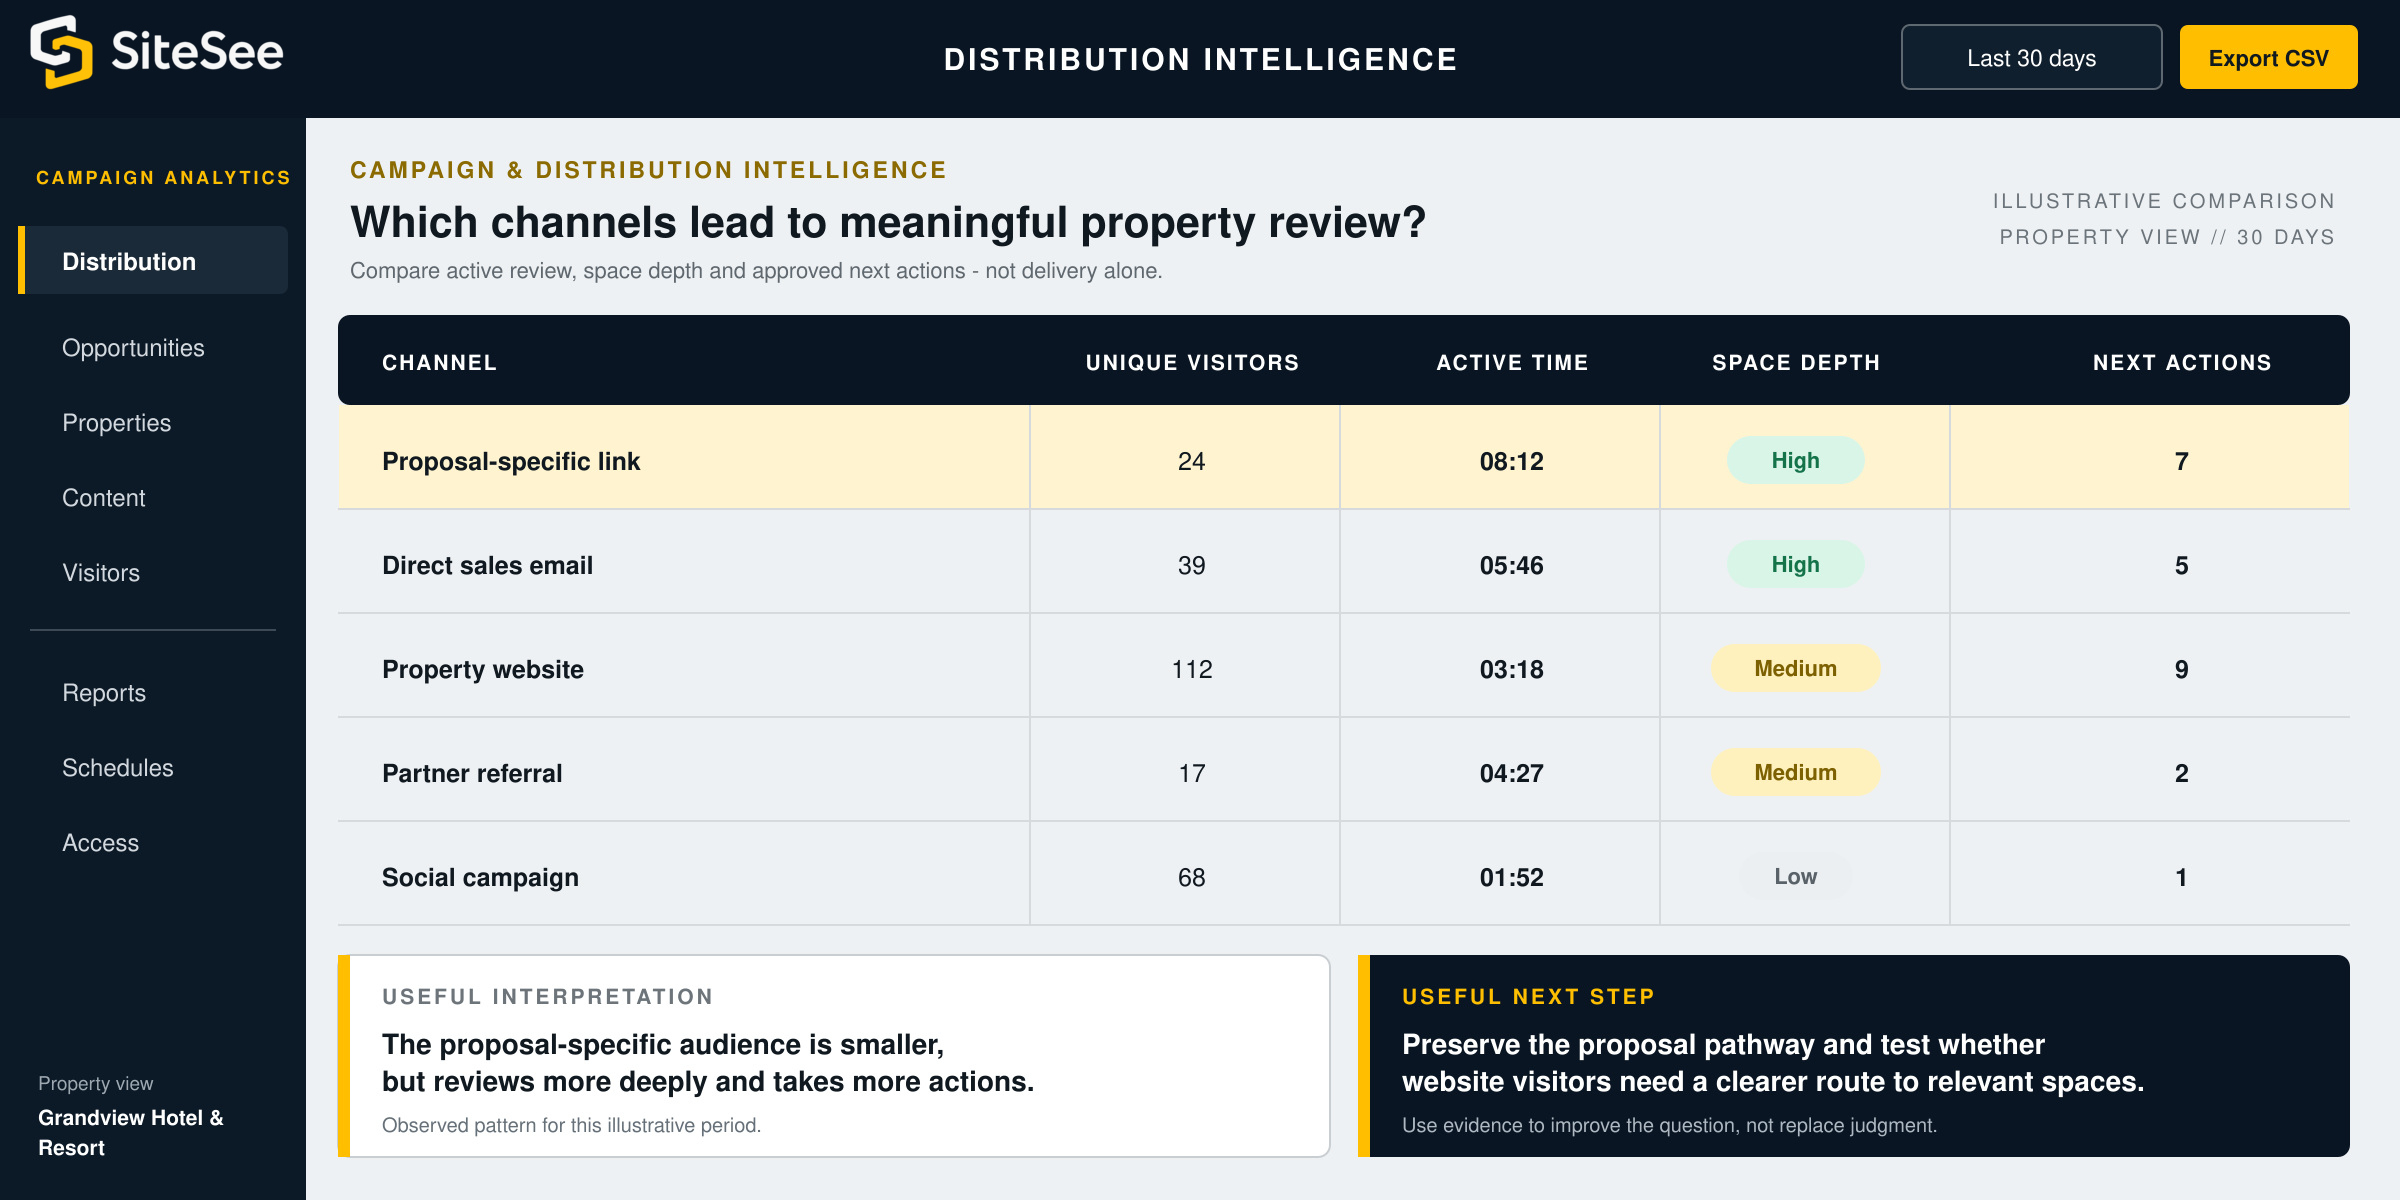
Distribution PerformanceExample comparison // 30 daysProperty view
ChannelUnique visitorsActive timeSpace depthNext actions
Proposal-specific link2408:12High7
Direct sales email3905:46High5
Property website11203:18Medium9
Partner referral1704:27Medium2
Social campaign6801:52Low1
Leadership & Portfolio Visibility
Give leadership useful commercial evidence without reducing the buyer journey to one number.
Buyer engagement should not disappear inside an individual seller’s inbox. Time-range filters, exported reports, scheduled analytics and controlled sharing can support property reviews, campaign comparisons and portfolio learning without forcing every stakeholder into the platform each day.
Reporting ArchitectureOpportunity → Property → PortfolioAccess controlled
Prepare the next conversation.
Review activity around one buyer, campaign or shared experience when the link and workflow support that level of context.
- Views, revisits and active time
- Space and content engagement
- Guided-path progression
- Contextual next actions
Improve the commercial asset.
See which spaces, content and distribution paths are performing across a selected period and use the evidence to refine the property experience.
- Date and campaign comparison
- Space and content rankings
- Traffic source and device patterns
- XLSX export and scheduled reporting
Find repeatable learning.
Compare approved measures across properties, markets or initiatives while preserving appropriate access and local context.
- Property and campaign comparison
- Shared measurement standards
- Recurring leadership reporting
- Password-protected analytics sharing
Measurement Scope
Choose the measurement layer that answers a real business question.
The best analytics plan is not the one that collects the most activity. It is the one that defines what the property needs to learn, names the pathways consistently and activates only the reporting required to support that decision.
Understand engagement.
Establish the core evidence needed to understand how the property experience is being used.
- Views and unique visitors
- Average or active time
- Source, device and browser context
- Space, content and CTA interactions
- Time filtering and spreadsheet export
Improve campaigns and reporting.
Add measurement layers that require plan entitlement, campaign design, permissions or an approved governance structure.
- Campaign-specific Smart Links
- Heat maps and deeper spatial reporting
- Scheduled analytics emails
- Shareable or password-protected analytics views
- Google Analytics and approved social tracking
Connect guided and portfolio learning.
Use more specialized analytics when the organization needs repeatable journey insight, multi-property comparison or custom system context.
- Guided-flow completion and drop-off
- Portfolio measurement standards
- Property and campaign rollups
- Custom reporting or API context
- Authoritative system connections where required
Measurement Trust
Measure behavior responsibly. Interpret it carefully.
Buyer intelligence becomes credible when the measurement question, consent structure, access rules and interpretation boundary are defined before launch. The platform should reveal useful behavior without pretending to know more than the evidence supports.
Name the business question first.Define what the property is trying to learn before creating links, labels, reports or dashboards.
Collect only what is useful and permitted.Configure forms, cookies, pixels and user tracking in accordance with applicable law, contract requirements, consent and brand policy.
Protect access to sensitive reporting.Use appropriate roles, permissions, designated recipients and password protection where the reporting context requires it.
Separate observation from conclusion.Analytics show what occurred inside the configured experience. They do not guarantee motive, identity, fit, revenue or a commercial outcome.
The responsible interpretation rule
Use analytics to ask better questions, not to replace human judgment.
Anonymous activity remains anonymous unless a visitor identifies themselves through an approved form, campaign workflow or connected system. Even when the opportunity context is known, observed behavior should guide the conversation rather than dictate the conclusion.
Evidence improves relevance. The salesperson, planner and customer still determine what the evidence means.Begin With the Decision You Need to Improve
Continue from what mattered instead of starting the property explanation over.
Define the buyer journey, property question or reporting need you want to understand. SiteSee can then connect the experience, campaign structure and analytics required to create useful evidence.